
Detecting False Breakouts: A Forex Trader’s Checklist to Stay Out of the Trap
Introduction
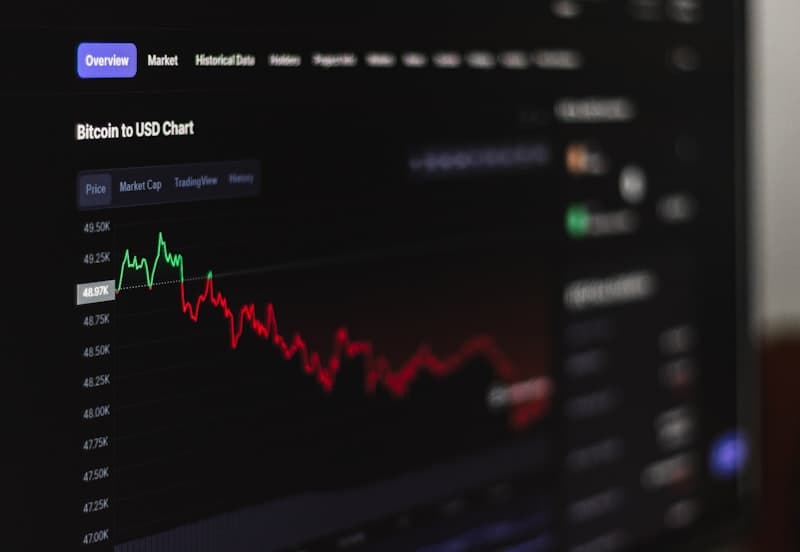
In fast‑moving markets like EUR/USD, GBP/USD, or even BTC/USD, a price surge that looks like a clean breakout can turn into a rapid reversal within a few pips. Those deceptive moves are called false breakouts and they are one of the most common reasons traders get trapped and suffer unnecessary drawdown. This article walks you through a step‑by‑step checklist that blends technical analysis, risk management, and practical examples so you can keep your trades on the right side of the market.
What Exactly Is a False Breakout?
A false breakout occurs when price briefly moves beyond a key level – usually a support, resistance, or trendline – and then quickly reverses back inside the prior range. The initial move often triggers stop‑loss orders and attracts breakout hunters, only for the market to snap back, leaving those traders with losses.
Key characteristics:
- Short‑lived momentum – the price spikes but lacks follow‑through volume.
- Immediate retest – the level that was supposedly broken is revisited within a few candles.
- Opposite price action – a bearish candle after a bullish breakout (or vice‑versa) appears on the next bar.
Why False Breakouts Happen
- Liquidity voids – Market makers push price into thin liquidity zones to fill hidden orders.
- News spikes – A sudden macro announcement can cause a temporary surge that fades once the market digests the data.
- Retail crowd behavior – Many traders set pending orders exactly at round numbers (e.g., 1.2000 for EUR/USD). When those orders are filled, the price often rebounds.
- Algorithmic hunting – High‑frequency bots detect breakout patterns and deliberately trigger them to collect stop‑losses.
Understanding the why helps you apply the right filters.
The Checklist: Spotting a False Breakout
Below is a practical, trading‑strategy‑oriented checklist you can apply on any timeframe. Use it before you place a breakout trade.
1. Confirm the Breakout on a Higher Timeframe
- Rule: If you’re eyeing a 1‑hour breakout, first verify that the same level is also broken on the 4‑hour or daily chart.
- Why: Higher timeframes carry more institutional participation, making genuine breakouts more reliable.
2. Look for Volume or Tick Confirmation
- Forex: While true volume isn’t available, the tick volume on MT4/MT5 can be a proxy. A breakout should be accompanied by a noticeable rise in tick count.
- Crypto: On BTC/USD, a real spike in on‑chain or exchange volume adds credibility.
3. Check Candlestick Structure
- Engulfing pattern: A bullish engulfing after a breakout adds strength; a small‑body candle suggests weakness.
- Doji or hammer: Presence of a doji at the breakout point often signals indecision – a red flag for a false move.
4. Use a Secondary Indicator for Confluence
- RSI: If the breakout occurs while RSI is still in overbought/oversold territory, treat it skeptically.
- MACD divergence: Look for divergence between price and MACD histogram; divergence often precedes a reversal.
5. Watch the Retest
- Rule: True breakouts frequently re‑test the broken level as new support/resistance. If the price slides back immediately without a clean retest, it’s likely a false breakout.
6. Apply the ATR‑Based Stop‑Loss
- Calculate the Average True Range (ATR) on the breakout timeframe. Set your stop‑loss a multiple (e.g., 1.5×ATR) away from the entry. If the market reaches your stop within two candles, the breakout was probably false.
7. Position Sizing and Risk %
- Keep risk per trade at 1–2% of your account balance. Even a perfect‑looking breakout can fail; limiting exposure protects your funded account from a single catastrophic loss.
Real‑World Examples
Example 1 – EUR/USD Daily Breakout
- Setup: EUR/USD approached the 1.2000 round‑number resistance on the daily chart.
- Breakout: A bullish candle closed at 1.2025 with modest tick volume.
- Check: On the 4‑hour chart, the price barely nudged above 1.2000 and immediately formed a doji. RSI stayed above 70, and MACD showed a bearish divergence.
- Result: The next day the pair retested 1.2000 and fell back to 1.1880. Traders who entered on the breakout lost ~130 pips.
- Lesson: The higher‑timeframe confirmation and lack of volume confluence flagged a false breakout.
Example 2 – GBP/USD 4‑Hour Breakout
- Setup: GBP/USD broke above a descending trendline at 1.3800.
- Confirmation: 1‑hour chart also showed a clear break, and tick volume spiked 45% higher than the previous average.
- Candles: A bullish engulfing candle followed the breakout, while RSI dropped from 55 to 48, indicating room for upside.
- Retest: The price retested 1.3800 three candles later and held, confirming a true breakout.
- Outcome: A disciplined trader entered with a 1.5×ATR stop‑loss and captured a 150‑pip move, preserving capital for future trades.
Example 3 – BTC/USD Intraday Spike
- Setup: BTC/USD surged from $28,500 to $29,300 within 15 minutes on a 5‑minute chart.
- Volume: Exchange volume doubled, but the move coincided with a scheduled crypto news release that later proved inconsequential.
- Retest: Price fell back to $28,600 within the next 30 minutes, forming a bearish pin bar.
- Takeaway: Even with high volume, news‑driven spikes can be deceptive; waiting for a confirmed retest saved traders from a 700‑pip loss.
Integrating the Checklist into a Prop‑Firm Evaluation
If you are pursuing a Funded Ocean Challenge – whether the 1‑Step or 2‑Steps evaluation – the same false‑breakout principles apply. Prop firms typically enforce strict drawdown limits (often 5–10%) and require consistent performance across multiple days. By using the checklist:
- You reduce the probability of large, un‑planned losses that could breach the drawdown threshold.
- You demonstrate disciplined position sizing and risk management, key metrics that prop firms track during the evaluation.
- A clean track record of avoiding false breakouts can accelerate your path to a Stealth or Titan funded account, and eventually the Scale Plan where you can manage up to $3,000,000.
When comparing the best prop firm 2026, look for flexible evaluation rules, low drawdown limits, and fast payouts – exactly what Funded Ocean offers.
Quick Reference Checklist (Copy‑Paste into Your Trading Journal)
| Step | Action | Indicator / Tool |
|---|---|---|
| 1 | Verify breakout on higher timeframe | Daily/4‑H chart |
| 2 | Check tick volume surge | Tick volume indicator |
| 3 | Analyze candlestick pattern | Engulfing, Doji, Hammer |
| 4 | Confirm with secondary indicator | RSI, MACD divergence |
| 5 | Observe retest behavior | Price action on 1‑H |
| 6 | Set ATR‑based stop‑loss | ATR (14) on breakout TF |
| 7 | Calculate risk % | 1–2% of account balance |
Final Thoughts
False breakouts are a natural part of forex trading and even crypto trading. The key is not to eliminate every breakout – that would mean missing genuine moves – but to filter out the low‑probability ones. By applying a structured checklist, respecting risk management principles, and aligning your approach with the expectations of a prop firm evaluation, you can protect your capital, stay within drawdown limits, and build a track record that qualifies you for a funded account.
Whether you trade a personal account or a Funded Ocean funded account, mastering the art of spotting false breakouts will make your trading strategy more robust and your profits more sustainable.
Published by the Funded Ocean Team.
More articles
Suggested reads from the blog
Mastering Support and Resistance on EUR/USD & GBP/USD: A Practical Guide for Forex Traders
·Technical Analysis
Mastering Candlestick Signals: Doji, Engulfing & Hammer for Forex and Crypto Traders
·Technical Analysis
Mastering Intraday Pivot Points: How to Calculate Daily, Weekly and Monthly Levels for Forex and Crypto
·Technical Analysis

Mastering Harmonic Patterns: A Practical Guide to Gartley, Butterfly, and Bat Setups for Forex Traders
·Technical Analysis